On-Balance Volume
ON-BALANCE VOLUME A price-volume relationship. Based on a cumulative volume, the on-balance volume relates price and volume in the stock market, and it has the formula: OBV = OBVprev + volume … if close...
ON-BALANCE VOLUME A price-volume relationship. Based on a cumulative volume, the on-balance volume relates price and volume in the stock market, and it has the formula: OBV = OBVprev + volume … if close...
MONEY FLOW Price times volume Money flow approximates the dollar value of a certain day’s trading. The formula is price multiplied by volume. Generally, a value of 80 is counted as overbought while a...
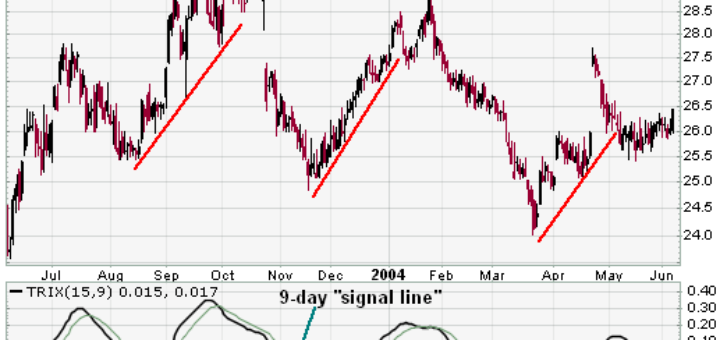
TRIX INDICATOR Price times volume The Trix Indicator (TI) shows the slope of a triple-smoothed exponential moving average. The term Trix is actually a shortcut of “triple exponential” and was developed by Jack Hutson...
STOCHASTIC OSCILLATOR (SO) A momentum indicator that uses support and resistance levels Calculations Dr. George Lane promoted this indicator in the 1950s. “Stochastic” refers to the location of a current price in relation to...
RELATIVE STRENGTH INDEX (RSI) a momentum oscillator J. Welles Wider developed the RSI and published it in a 1978 book, “New Concepts in Technical Trading Systems”. It was also published in Commodities magazine (now...
PARABOLIC SAR (PS) used to find trends in market prices and securities J. Welles Wilder Jr. devised the Parabolic Stop and Reverse (SAR) to find trends in market prices or securities. The method can...
MOVING AVERAGE CONVERGENCE/DIVERGENCE (MACD) a lagging indicator that is also a form of Absolute Price Oscillator Definitions Gerald Appel developed MACD as a technical analysis indicator in the late 1970s. MACD shows the difference...
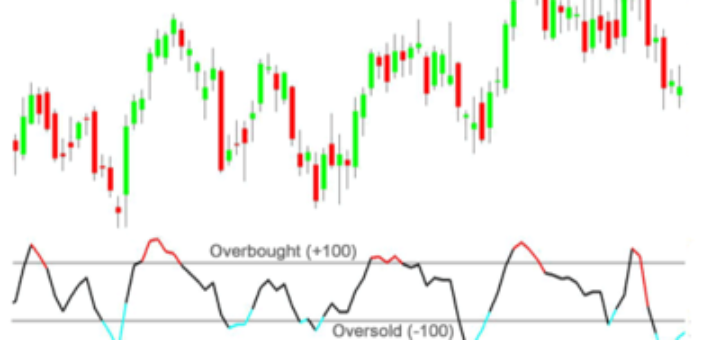
COMMODITY CHANNEL INDEX (CCI) used in identifying cyclical trends in commodities, equities and currencies Donald Lambert introduced the CCI (an oscillator) in an article published in the October 1980 issue of Commodities magazine (now...
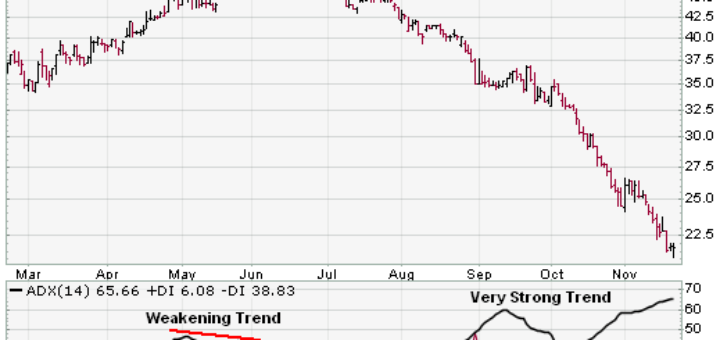
AVERAGE DIRECTIONAL INDEX (ADX) an indicator of trend strength J. Welles Wilder created the Average Directional Index in 1978 as an indicator of trend strength in a series of prices of a financial instrument....
ADVANCE DECLINE LINE (ADL) measures the number of individual stocks participating in a market rise or fall Definition The ADL is a stock market indicator used by speculators to measure the number of individual...
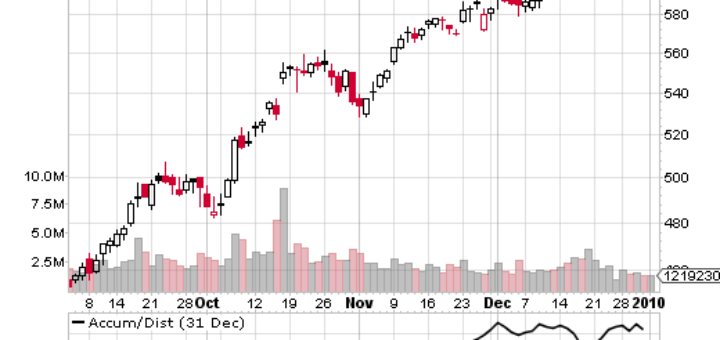
ACCUMULATION/DISTRIBUTION INDEX (ADI) A cumulative total volume analysis indicator Marc Chaikin created the ADI as a cumulative total volume technical analysis indicator. The ADI adds or subtracts each day’s volume in proportion to where...