Commodity Channel Index
COMMODITY CHANNEL INDEX (CCI)
used in identifying cyclical trends in commodities, equities and currencies
Donald Lambert introduced the CCI (an oscillator) in an article published in the October 1980 issue of Commodities magazine (now known as Futures magazine). Since its introduction, the indicator has become very popular and is now a very common tool for traders in identifying cyclical trends. Not only is it used as a tool in commodities, but also equities and currencies. The CCI can be adjusted to the timeframe of the market traded on by simply changing the averaging period.
Calculations
The CCI is calculated as the difference between the typical price of a commodity and its simple moving average. It is then divided by the mean absolute deviation of the typical price. The index is usually scaled by an inverse factor of 0.015 to provide more readable numbers:
CCI = 1/0.015 pt – SMA(pt) / σ (pt)
Legend: pt the typical price (average of the High, Low, and Closing prices)
SMA the simple moving average
σ the mean absolute deviation.
Interpretation
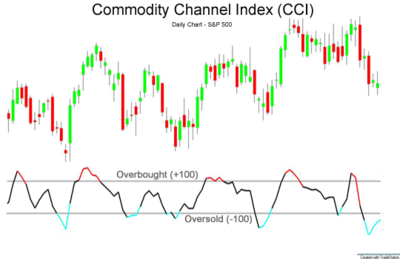
The Commodity Channel Index is mostly used for identifying divergences from price trends as an overbought/oversold indicator, and to draw patterns on it and trade according to those patterns. This is similar to Bollinger Bands, but is presented as an indicator rather than as overbought/oversold levels.
The CCI typically goes above and below a zero line. Normal oscillations will occur within the range of +100 and -100. Readings above +100 imply an overbought condition, while readings below -100 imply the opposite (oversold). Similar to other overbought/oversold indicators, this means that there is a big possibility that the price will correct itself to levels that are more representative.
Notes:
1. The CCI can be adjusted to the timeframe of the market traded on by simply changing the averaging period.