Money Flow
MONEY FLOW
Price times volume
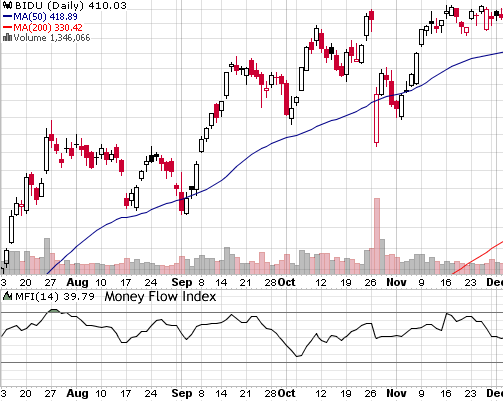
Money flow approximates the dollar value of a certain day’s trading. The formula is price multiplied by volume. Generally, a value of 80 is counted as overbought while a value of 20 is considered as oversold. Differences in the MFI (money flow indicator) and price action are significant. If the price makes a new rally high but the MFI high is lower than the previous high, then it is counted as a weak advance. Furthermore, this situation is likely to reverse.
Furthermore, money flow refers to dollar volume, the total value of shares traded. It should be differentiated from money “flowing into” the stock. An up day represents the enthusiasm of the buyers while the down day represents the enthusiasm of the sellers. An excessive proportion to a certain direction will likely result in a price reversal.
MFI and RSI (relative strength index) have a similarity. Both look at up days against total up plus down days, but what is accumulated on those days, is dollar volume for the MFI, as opposed to price change amounts for the RSI.
