Trend Lines
TREND LINES
a bounding line for the movement of a security
Definitions:
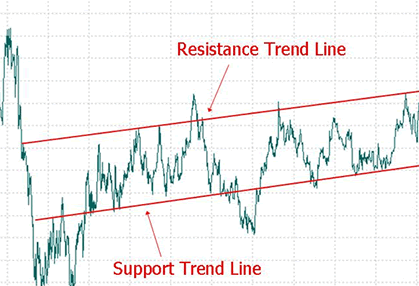
1) When you can draw a diagonal line between two or more price pivot points, you can then form a trend line.
2) The bounding line for the price movement of a security is a trend line.
3) When a security’s price decreases, then rebounds at a pivot point that aligns with at least two previous support pivot points a support trend line is formed.
4) When a security’s price increases, then rebounds at a pivot point that aligns with at least two previous resistance pivot points a resistance trend line is formed.
Common Use:
The common use of a trend line is to judge entry and exit investment timing when trading securities. Trend lines are a simple and widely used method for technical analysis especially for entry and exit investment timing.
Trend lines typically go hand in hand with price charts but is not limited to the latter. It can also be used with a range of other charts like MACD and RSI. A trend line can be used to identify positive and negative trending charts,
(a) a positive trending chart forms an upward slope when the support and the resistance pivots points are aligned, and
(b) a negative trending chart forms a downward slope when the support and resistance pivot points are aligned.
Application of Trend Lines:
Traders can use trend lines in lots of ways. If a stock price is moving between support and resistance trend lines, then a trader can buy a stock at support and sell at resistance, then short at resistance and cover the short at support. This is done because when the price returns to an existing principal trend line, there may be chances for new positions in the direction of the trend to open.
Another way is when the price action breaks through the principal trend line of an existing trend. This implies that the trend may fail. In this case a trader may have 2 options. He can opt in (1) trading in the opposite direction of the existing trend, or (2) exiting positions in the direction of the trend.
