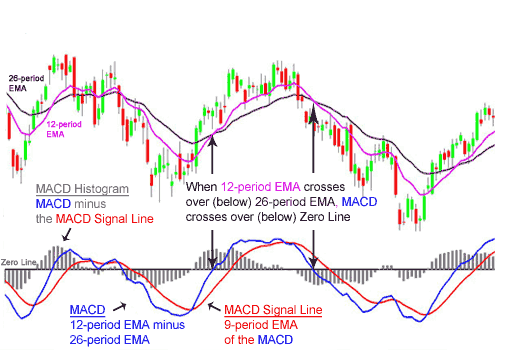
MOVING AVERAGE CONVERGENCE/DIVERGENCE (MACD)
a lagging indicator that is also a form of Absolute Price Oscillator
Definitions
Gerald Appel developed MACD as a technical analysis indicator in the late 1970s. MACD shows the difference between a fast and slow exponential moving average (EMA) of closing prices.
MACD is a type of Absolute Price Oscillator (APO). This means that it takes the difference of two price EMAs. An alternate form of price oscillator is the Percentage Price Oscillator (PPO) which is derived by dividing the difference between two moving averages of price by the longer moving average value. The relative values generated by a PPO will differ from an APO (or MACD) in significant ways, and are preferred when (1) comparing the oscillator values between different securities, especially of widely different prices, or (2) comparing oscillator values for the same security at significantly different times (especially for a security whose value has changed greatly). The APO or MACD will show greater oscillator extremes for higher priced securities. This is not the case with the PPO.
The set of periods for the averages can be varied. Appel and others have experimented with different combinations. The usual set of parameters is written as 12,26,9 for the fast EMA, slow EMA and signal line periods respectively.
How to Calculate MACD Formulas
The standard periods originally published by Gerald Appel are 12 and 26 days:
MACD = EMA of price – EMA of price
A signal line (or trigger line) is then formed by smoothing this with a further EMA. The standard period for this is 9 days,
signal = EMA of MACD
The difference between the MACD and the signal line is often calculated and shown not as a line, but a solid block histogram style. This construction was made by Thomas Aspray in 1986. The calculation is
histogram = MACD − signal
Interpretation
MACD lines are often regarded as a trend following indicator designed to identify trend changes. Three types of trading signals are generated:
1. MACD line crossing the signal line (suggests that the direction of the acceleration is changing).
2. MACD line crossing 0 (indicates that the average velocity is changing in direction).
3. Divergence between price and histogram, or between MACD line and price.
The usual trading rule is the signal line crossing. It suggests to buy when the MACD crosses up through the signal line, or sell when it crosses down through the signal line. Since these crossings may occur too often, other tests may have to be taken.
It is considered Bullish if a crossing of the MACD line up through zero happens. If it is down through zero line then it is viewed as bearish. These crossings are simply the original EMA(12) line crossing up or down through the slower EMA(26) line.
Sometimes it is wise to apply a price filter to the Bullish Moving Average Crossover to make sure that it will hold. An example of a price filter would be to buy if MACD goes above the 9-day EMA and remains there for about three days. The buy signal would then start when the third day ends.
The Signal Line, Acceleration, and Change of Direction
The MACD is a filtered measure of the velocity. The velocity has been passed through two first order linear low pass filters which results in the “signal line” and is then filtered again. The measure of the acceleration, is the difference between those two, the histogram, and with all three filters applied.
Note:
1. Since it is based on moving averages, MACD is inherently a lagging indicator.
