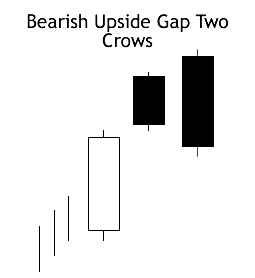
Bearish Upside Gap Two Crows Pattern
BEARISH UPSIDE GAP TWO CROWS PATTERN (BUGTCP)
crows that warn a top reversal
Characteristics:
1. The market is on an uptrend;
2. The long white candlestick on the Day 1 shows the continuation of the uptrend;
3. A black body with a gap shows up on Day 2;
4. Another black stick develops on Day 3. Its opening is higher than that of Day 2 and its closing is lower than Day 2’s; and
5. Day 3’s close is above the close of Day 1.
Brief Explanation:
This shows a market that is on an uptrend and it displays a higher opening with a gap. But the Day’s new highs cannot hold and thus the black candlestick. The bulls are still a bit comfortable since the close on Day 2 is still higher than the previous day’s close. Day 3 however shows the bearish sentiment because there is another new high but it fails to hold these highs until the close. Day 3 even closes below Day 2’s close, which is another bearish sign.
Why do the new highs fail to hold? Why does the market close lower? These point to the reality that the market is not as strong as bulls would like to think.
